
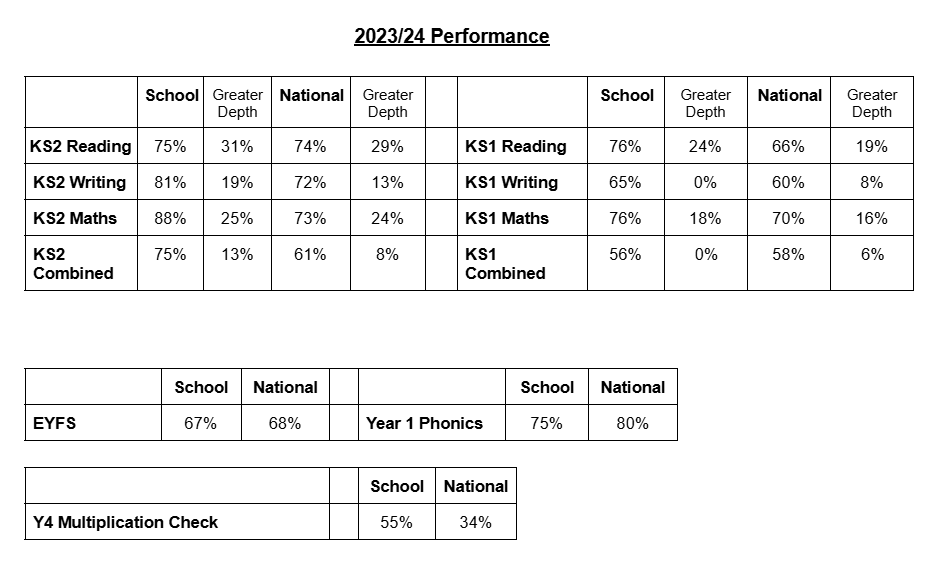
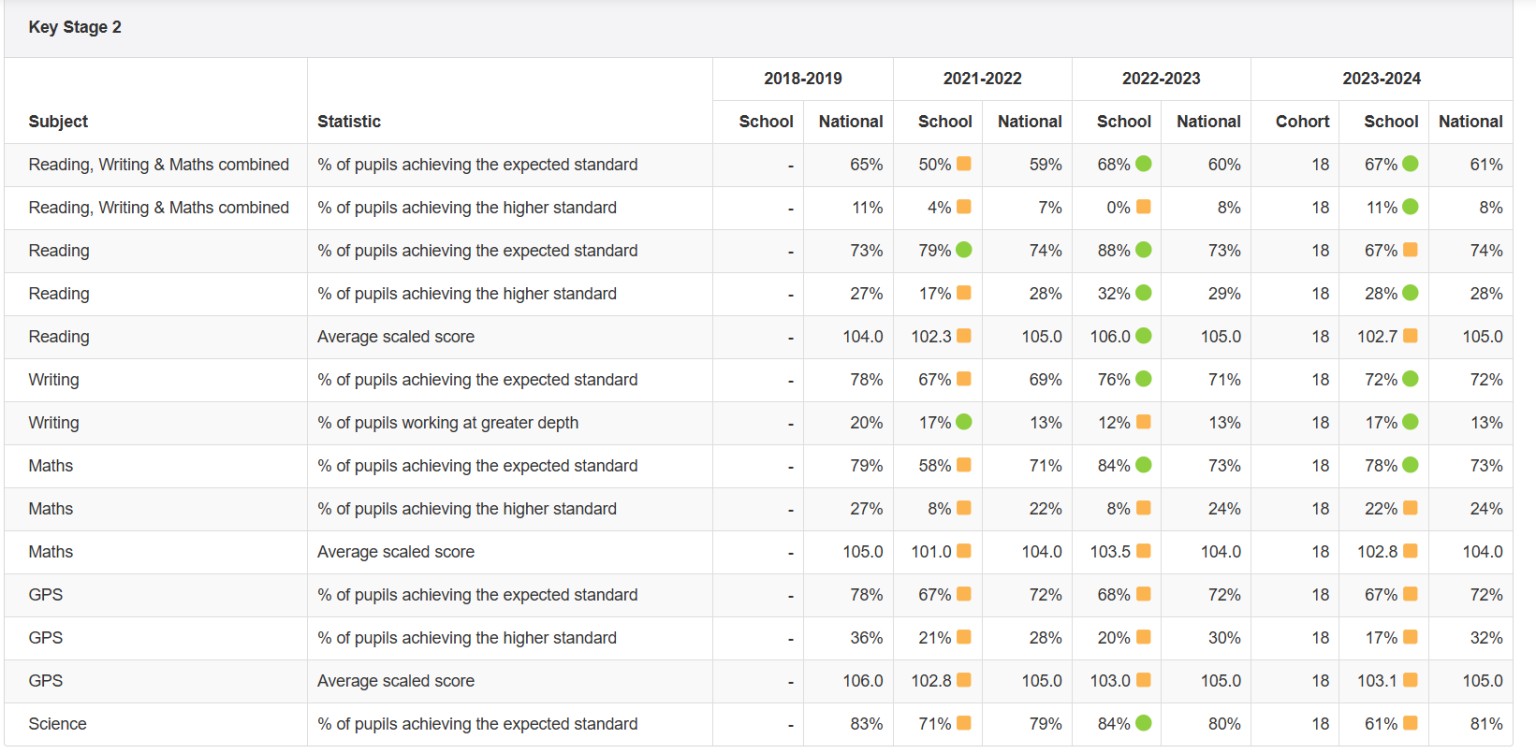
Key Stage Two Data 2019 - 2024
-
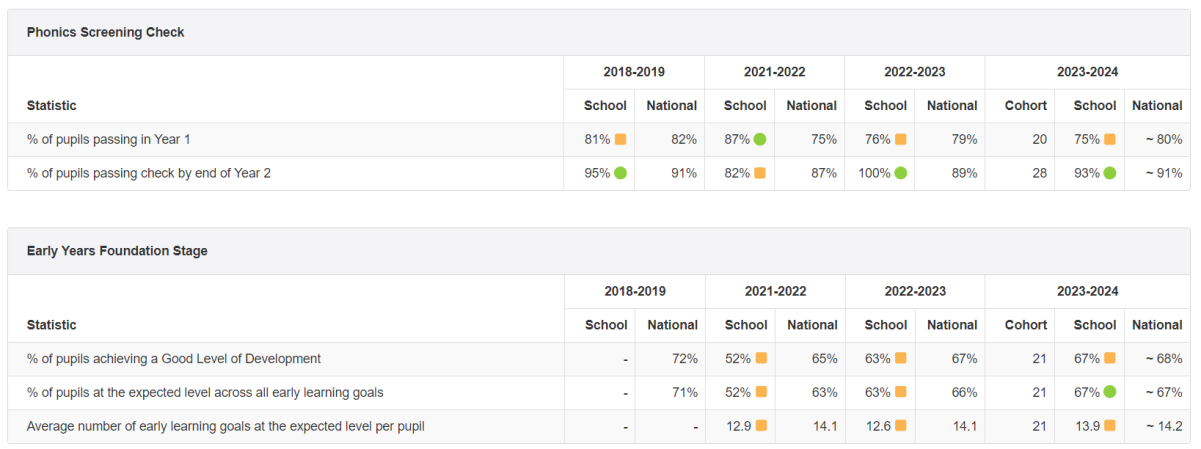
Phonics and MTC 2019-2024
EYFS DATA 2016-19
Below, you will find information about how well our children in Foundation Stage performed in 2019.
These are shown alongside the results in Plymouth and the National results (Percentages have been rounded to the nearest integer).
These are shown alongside the results in Plymouth and the National results (Percentages have been rounded to the nearest integer).
| KS2 Reading Results | Keyham Barton 2016 | National Results 2016 | Keyham Barton 2017 | National Results 2017 | Keyham Barton 2018 | National Results 2018 | Keyham Barton 2019 | National Results 2019 |
| Expected Standard | 64% | 66% | 61% | 75% | 54% | 75% | 86% | 73% |
| Greater Depth | 25% | 19% | 25% | 25% | 14% | 28% | 29% | 27% |
| Average Score | 103% | 103% | 101.8% | 104.1% | 101.5% | 105.0% | 106.1% | 104.4 |
| Progress measure | 0.8 | N/A | -1.29 | N/A | -1.42 | N/A | 3.5 | tbc |
Key Stage 1 SATs Data 2016-19
Year 1 Phonics
| % Year one passed | National % | |
| 2016 | 73% | 81% |
| 2017 | 93% | 81% |
| 2018 | 82% | 81% |
| 2019 | 83% | 81% |
KS1 SATs Data 2016-19
Below you will find information regarding the performance of our Year 2 children at the end of Key Stage One. These are Teacher Assessment Levels.
KS1 SATs Reading Data 2016-19
| % at expected level | National % at expected level | |
| 2016 | 74% | 74% |
| 2017 | 79% | 76% |
| 2018 | 79% | 75% |
| 2019 | 75% | 75% |
| % at greater depth | National % at greater depth | |
| 2016 | 22% | 24% |
| 2017 | 7% | 25% |
| 2018 | 14% | 26% |
| 2019 | 37% | 25% |
KS1 SATs Writing Data 2016-19
| % at expected level | National % at expected level | |
| 2016 | 48% | 65% |
| 2017 | 66% | 68% |
| 2018 | 69% | 70% |
| 2019 | 75% | 69% |
| % at greater depth | National % at greater depth | |
| 2016 | 4% | 13% |
| 2017 | 0% | 16% |
| 2018 | 3% | 16% |
| 2019 | 21% | 15% |
KS1 Maths SATs Data 2016-19
| % at expected level | National % at expected level | |
| 2016 | 74% | 75% |
| 2017 | 62% | 75% |
| 2018 | 72% | 76% |
| 2019 | 79% | 76% |
| % at greater depth | National % at greater depth | |
| 2016 | 4% | 18% |
| 2017 | 0% | 21% |
| 2018 | 7% | 22% |
| 2019 | 33% | 21% |
Key Stage 2 SATs Data 2016-19
Key Stage 2 SATs Data
Below you will find information regarding the performance of our Year 6 children in their SATs from 2016 to 2019 in Mathematics, Reading and Grammar, Punctuation and Spelling. You will also find the Teacher Assessment results for Writing.
Below you will find information regarding the performance of our Year 6 children in their SATs from 2016 to 2019 in Mathematics, Reading and Grammar, Punctuation and Spelling. You will also find the Teacher Assessment results for Writing.
KS2 SATs Reading Data 2016-19
| KS2 Reading Results | Keyham Barton 2016 | National Results 2016 | Keyham Barton 2017 | National Results 2017 | Keyham Barton 2018 | National Results 2018 | Keyham Barton 2019 | National Results 2019 |
| Expected Standard | 64% | 66% | 61% | 75% | 54% | 75% | 86% | 73% |
| Greater Depth | 25% | 19% | 25% | 25% | 14% | 28% | 29% | 27% |
| Average Score | 103% | 103% | 101.8% | 104.1% | 101.5% | 105.0% | 106.1% | 104.4 |
| Progress measure | 0.8 | N/A | -1.29 | N/A | -1.42 | N/A | 3.5 | tbc |
KS2 SATs Grammar, Punctuation and Spelling 2016-19
| KS2 SPAG Results | Keyham Barton 2016 | National Results 2016 | Keyham Barton 2017 | National Results 2017 | Keyham Barton 2018 | National Results 2018 | Keyham Barton 2019 | National Results 2019 |
| Expected Standard | 75% | 73% | 79% | 77% | 79% | 78% | 95% | 78% |
| Greater Depth | 18% | 28% | 36% | 31% | 7% | 34% | 48% | 36% |
| Average Score | 103% | 103% | 106.3% | 106% | 102.6% | 106.2% | 109.1% | 106.3 |
| Progress measure | N/A | N/A | N/A | N/A | N/A | N/A | N/A | N/A |
KS2 Writing (Teacher Assessment) 2016-19
| KS2 Writing Results | Keyham Barton 2016 | National Results 2016 | Keyham Barton 2017 | National Results 2017 | Keyham Barton 2018 | National Results 2018 | Keyham Barton 2019 | National Results 2019 |
| Expected Standard | 48% | 73% | 75% | 76% | 79% | 78% | 90% | 78% |
| Greater Depth | 25% | 19% | 32% | 18% | 25% | 20% | 33% | 20% |
| Progress measure | -3.98 | N/A | +2.03 | N/A | +2.95 | N/A | 4.2 | N/A |
KS2 SATS Mathematics 2016-19
| KS2 Maths Results | Keyham Barton 2016 | National Results 2016 | Keyham Barton 2017 | National Results 2017 | Keyham Barton 2018 | Keyham Barton 2019 | National Results 2019 |
| Expected Standard | 57% | 70% | 75% | 75% | 79% | 95% | 79% |
| Greater Depth | 21% | 23% | 21% | 17% | 14% | 58% | 27% |
| Average Score | 103% | 104% | 105.3% | 104.2% | 102.7% | 109.3% | 105 |
| Progress measure | -0.2 | N/A | +2.20 | N/A | +0.61 | 5.7 | N/A |
Key Stage Once SAT's Data 2019 - 2024
Expected Standard in Reading, Writing and Maths 2016-19
| Keyham Barton 2016 | National Results 2016 | Keyham Barton 2017 | National Results 2017 | Keyham Barton 2018 | National Results 2018 | Keyham Barton 2019 | National Results 2019 | |
| Expected Standard | 46% | 52% | 54% | 61% | 54% | 62% | 76% | 65% |